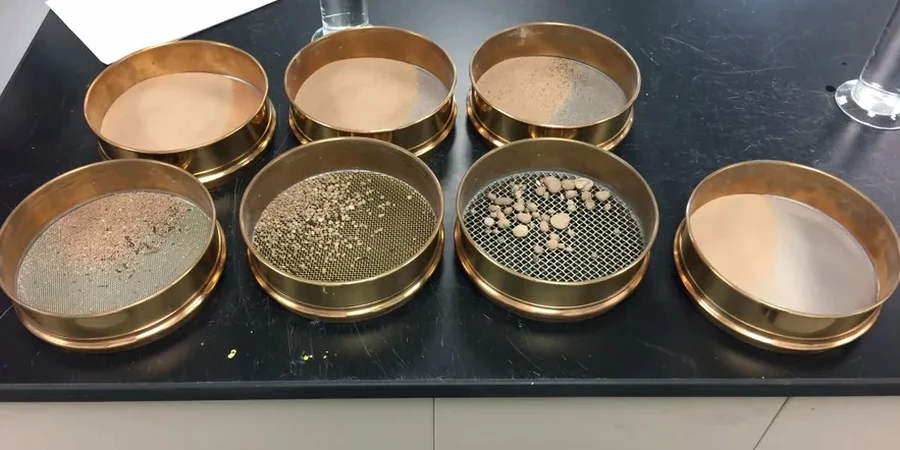
The soil profile across Corpus Christi shifts dramatically between the caliche-rich uplands on the south side and the soft deltaic clays that dominate the area around the Port and North Beach. A foundation design that works near South Padre Island Drive may be completely inadequate for a site just two miles north, where the Nueces River floodplain deposits fine silts and expansive clays. That variability is precisely why we run combined sieve and hydrometer analysis on every project—the full grain size distribution curve, from coarse sand down to colloidal clay, is what tells you whether your bearing stratum will drain or hold water. When the Atterberg limits come back borderline, the hydrometer data often reveals a clay fraction that explains the plasticity, and that single data point can change the foundation recommendation from a shallow footing to a deeper pile system before the structural engineer even starts detailing.
A full hydrometer curve on Corpus Christi bay clay typically reveals 40-60% passing the No. 200 sieve—numbers that change everything about settlement calculations and drainage design.
Methodology and scope
The coastal humidity and frequent storm surge events along the Texas Gulf Coast accelerate weathering of the local Beaumont Formation clays, producing a high percentage of fines that simple field classification misses. Our laboratory runs the full ASTM D6913 wet-sieve procedure followed by ASTM D7928 hydrometer sedimentation, giving you a continuous particle size distribution from 75 mm down to 0.001 mm. We report percent gravel, sand, silt, and clay with the coefficient of uniformity (Cu) and coefficient of curvature (Cc) calculated automatically—numbers that feed directly into USCS classification per ASTM D2487 and into seepage models when you are designing dewatering systems for excavations near Oso Bay. The hydrometer portion uses sodium hexametaphosphate dispersion and temperature-corrected readings at 0.5, 1, 2, 5, 15, 30, 60, 250, and 1440 minutes, so the fine fraction curve has enough points to pick up even subtle inflection that indicates a gap-graded fabric. For projects where the sand fraction dominates, we also recommend running a
Proctor compaction test on the same material, because the grain size envelope directly controls the achievable dry density and optimum moisture content in the field.
Local considerations
Corpus Christi sits at an average elevation of just 7 feet above sea level, with large portions of the city built on Holocene alluvium that contains interbedded organic silts and loose fine sands. The 1918 hurricane and subsequent storm events have deposited layers of overwash sand that are notoriously poorly graded—a grain size curve that plots as a near-vertical line on the semi-log chart, with a uniformity coefficient below 3. That kind of material is highly susceptible to internal erosion and piping under the hydraulic gradients generated by even moderate dewatering. When you skip the hydrometer analysis and classify solely by visual-manual methods, you routinely underestimate the silt content by 15 to 25 percent, which leads to overestimated permeability and undersized drainage systems. We have seen this exact problem on projects near the Inner Harbor, where groundwater moves through thin sand lenses that the boring logs described as clean sand but the lab curve showed 22% passing the No. 200 sieve—enough fines to plug a well screen in under 48 hours of continuous pumping.
Frequently asked questions
What is the typical turnaround time for a grain size analysis with hydrometer?
The sieve portion can be completed in one working day. The hydrometer sedimentation requires a minimum of 24 hours of settlement readings, plus oven-drying time for the fine fraction. We typically deliver the full combined report—sieve data, hydrometer curve, calculated coefficients, and USCS classification—within 3 to 5 business days of receiving the sample. Rush service is available with a 48-hour turnaround when project schedules demand it.
How much sample material do you need to run both the sieve and hydrometer tests?
For a combined analysis we require approximately 500 grams of material passing the No. 4 sieve for the hydrometer portion, plus a larger bulk sample—typically 2 to 5 kilograms—to obtain a representative split for the sieve stack. If the material contains gravel-sized particles, we need enough bulk sample to run the full coarse analysis without re-splitting. We provide sampling instructions and containers for every project.
What does a grain size analysis cost in Corpus Christi?
A combined sieve and hydrometer analysis typically ranges from US$100 to US$180 per sample, depending on the number of samples in the batch and whether specific gravity determination on the fine fraction is included. Sieve-only analysis for clean sands starts at the lower end of that range. We provide a firm quote after reviewing the project specifications and sample count.